Competitive intelligence programs rarely die because the intelligence was wrong. They die in a budget meeting, when someone asks what the program changed and the honest answer is a number of battlecards published and a number of newsletter opens.
Those are real numbers. They are also the wrong ones, because neither of them is something a CFO can connect to revenue. A CI function that reports output instead of outcome is structurally indefensible: it looks like a cost center producing documents, because the only evidence it offers is documents.
The fix is not more reporting. It is picking a small set of metrics that sit on the path between a competitor signal and a closed deal, baselining them before you start, and showing movement. This guide covers nine of them, organized by what they actually prove, plus where to source each number and the three metrics worth deleting from your deck.
The three layers a CI metric can live in
Before the list, the structure. Every CI metric answers exactly one of three questions, and programs get into trouble when they report only from the first layer.
Layer 1: coverage. Are we seeing the things we need to see, fast enough to act? This layer measures the sensing system.
Layer 2: adoption. Is the intelligence reaching the people whose behavior it should change, and are they using it? This layer measures distribution.
Layer 3: outcome. Did the behavior change produce a commercial result? This layer measures impact.
Coverage without adoption is a research hobby. Adoption without outcome measurement is a faith-based program. Outcome metrics alone are unactionable, because when the number moves the wrong way you have no idea which part of the machine broke. You need all three layers, and you need to report them in that order, so the causal chain is visible on one page.
Layer 1: coverage metrics
1. Detection lag
Definition: the median number of days between a competitor event happening and your team knowing about it.
This is the single most diagnostic CI metric, and almost nobody tracks it, because tracking it requires admitting how late you usually are. Measure it per signal class, not in aggregate: a pricing page change, a funding round, a new enterprise logo, and a competitor rep working one of your accounts have wildly different lags and wildly different decay curves.
How to measure it: every time you log a competitor event, record two dates. The date the event actually occurred (which you can usually reconstruct from a timestamp, a press release date, a sitemap change, or an archive snapshot) and the date your team first recorded it. Report the median and the 90th percentile.
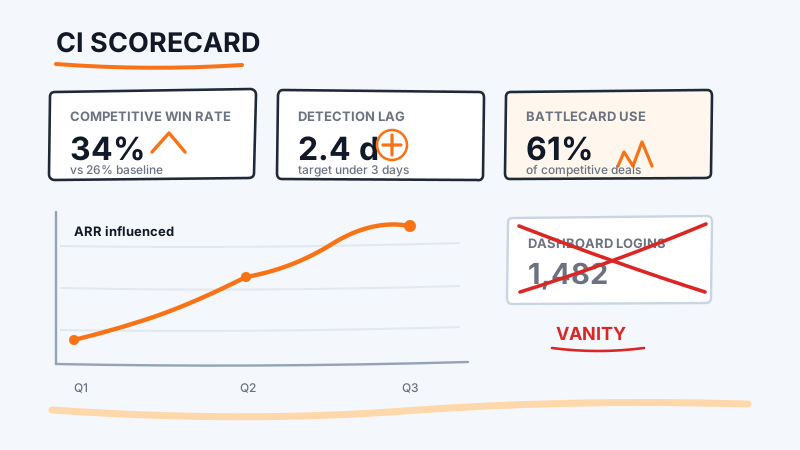
Target: under 3 days median for monitored surfaces. If you are above 14 days, you do not have a CI program, you have a research habit, and no downstream metric will save it.
Detection lag is also the metric most directly improved by tooling rather than effort, because the bottleneck is checking frequency, not analysis skill. The hardest signal class to compress is competitor sales activity, since there is no press release when a rep starts working one of your accounts. CAM exists for that specific gap: it monitors the new LinkedIn connections of your competitors’ sales reps on a cadence you set per profile (every 24 hours, 7 days, or 30 days) and sends real-time alerts plus a ranked lead list after every run. Because you choose the check frequency, detection lag on competitor sales activity becomes a number you set rather than a number you discover.
2. Watchlist completeness
Definition: the percentage of your defined competitor set with active monitoring on every surface you have declared in scope.
Write down the surfaces that matter for your market (pricing page, changelog, job postings, review sites, leadership moves, sales team activity), then build a simple grid of competitors against surfaces and score the fill rate. Most teams discover they have deep coverage on their top competitor and nothing at all on the two insurgents who are actually taking deals.
Target: 100 percent on your named top five, with an explicit and documented decision about every gap. A declared gap is a strategy. An undiscovered gap is a risk.
3. Signal-to-noise ratio
Definition: the percentage of alerts you deliver that a recipient marks as useful or acts on.
This is the metric that keeps a CI program from destroying itself through volume. The failure mode is well known: a team wires up aggressive monitoring, floods a Slack channel, reps mute the channel in week three, and the program’s distribution channel is dead while its coverage metrics look excellent.
How to measure it: attach a one-click useful or not-useful reaction to every alert, and report the rolling 30-day percentage. Below 50 percent, cut volume immediately and tighten your filters. The goal is not maximum signals, it is maximum acted-upon signals.
Layer 2: adoption metrics
4. Competitive deal coverage
Definition: the percentage of open competitive opportunities where the competitor field is populated and a CI asset has been attached or viewed.
This is the metric that reveals whether CI has actually entered the sales motion or is sitting in a wiki next to it. Pull it from your CRM. If your reps are not naming the competitor on the opportunity record, nothing downstream can be measured, so this metric doubles as a data-hygiene forcing function.
Target: competitor named on 80 percent or more of qualified competitive deals. Below that, your win-rate numbers are built on a sample you cannot trust.
5. Battlecard engagement rate
Definition: the percentage of reps who opened the relevant battlecard during an active competitive deal, within 7 days of the competitor being identified.
Note what this is not: total page views. Total views are inflated by your own team, by onboarding, and by curiosity. What you want is in-deal usage, which is the only usage that can affect an outcome. Most content platforms and sales enablement tools can scope views to a user and a date range, which is all you need to compute this.
Target: 60 percent or better. If your battlecards are long, the number will be low, and the correct response is shorter cards rather than a usage mandate.
6. Time to answer
Definition: the median hours between a rep asking a competitive question and receiving a usable answer.
Every CI team has an inbound queue, whether or not it is formalized. Measure it, because this number sets the ceiling on how much your reps will trust you. A rep who waits two days for a competitor objection response learns to improvise instead, permanently, and that habit does not reverse when your SLA improves later.
Target: under 4 working hours for in-deal questions. The practical way to hit it is a self-serve layer that handles the top 20 recurring questions, so the queue only ever receives genuinely novel ones.
Layer 3: outcome metrics
7. Competitive win rate, against baseline
Definition: your win rate in deals where a specific competitor was present, tracked over time against the pre-program baseline.
This is the headline number, and it comes with one rule that determines whether anyone believes it: you must establish the baseline before the program starts, segmented by competitor. A single blended competitive win rate is nearly useless, because it moves when your deal mix moves, not when your intelligence improves. Report it per competitor, with deal counts visible so small-sample noise is obvious.
Also report it as a delta against your non-competitive win rate during the same period. That control group absorbs the market conditions that would otherwise get credited to or blamed on your CI work.
8. Competitive deal cycle length
Definition: median days from qualification to close in competitive deals, compared against non-competitive deals.
Good competitive intelligence should compress this gap, because the mechanism is specific and testable. Reps who know the competitor’s pricing structure, the three objections they will hear, and the two features where the competitor is genuinely stronger spend fewer cycles discovering it in meetings. If your win rate rises but your competitive cycle length stays flat, your intelligence is probably helping reps defend late rather than frame early.
This metric also catches a failure mode win rate hides: a program that improves win rate by making reps more cautious, pushing them to walk away from winnable deals. Pair the two numbers and that pattern shows up immediately.
9. Pipeline influenced by a competitive signal
Definition: the value of pipeline created from opportunities that were sourced or re-engaged off a specific competitor signal, with the signal recorded on the record.
This is the metric that converts CI from a defensive cost into a sourcing channel, and it is the one most likely to survive a budget review intact. The requirement is attribution discipline: the signal has to be stamped on the opportunity at creation, not reconstructed afterward. Reconstructed attribution is always disputed and never believed.
The signals that generate pipeline rather than just informing it tend to be the ones with a clear timing component: a competitor’s funding round, a leadership change, a rep suddenly appearing in an account you thought was quiet. That last category is why CAM’s LinkedIn connection tracking is a pipeline input and not only a research input. A prospect connecting with a competitor rep is an in-market signal with a date attached, enriched with job title, company, industry, size, and location, and scored against your ICP so the list arrives already ranked.
The three metrics to stop reporting
Assets published. A count of battlecards, teardowns, and newsletters measures how busy the CI team was, not whether anything changed. It also creates an incentive to publish more and shorter-lived material. Report usage instead.
Dashboard logins or portal sessions. This measures curiosity, not application. A rep who logs in weekly and never changes a call plan is indistinguishable from an engaged user in this number.
Total alerts delivered. Volume is not value, and reporting it rewards exactly the behavior that kills adoption. Replace it with signal-to-noise ratio, which penalizes the same volume that this metric rewards.
The pattern across all three: they are easy to collect, they always go up, and they are uncorrelated with impact. Metrics that only move in one direction are not measurements, they are decoration.
Instrumenting this in 30 days
You do not need a data warehouse. You need four things in place, in this order.
Week 1: baseline. Pull trailing four quarters of closed-won and closed-lost, segmented by named competitor. Compute win rate and cycle length per competitor and for the non-competitive control group. Freeze these numbers in a document with a date on it. This is the single highest-value hour in the whole project, and it is unrecoverable later, which is why skipping it is the most common fatal mistake.
Week 2: CRM fields. One required competitor picklist on qualified opportunities, one optional free-text competitive signal field, and a validation rule that fires at the stage where competitors are usually known. Resist adding more. Every extra required field reduces the fill rate of the ones that matter.
Week 3: the feedback loop. Add useful and not-useful reactions to your alert channel and a timestamp log on your inbound question queue. These two cheap instruments produce metrics 3 and 6 with no further work.
Week 4: the one-page report. Nine numbers, three layers, each with its baseline and its trailing three-month trend. One page, monthly, same format every time. The format consistency matters more than the design, because the audience learns to read it and starts asking about the deltas themselves.
For the parts of this that need to come out of your monitoring stack rather than your CRM, pull them programmatically rather than by hand. CAM publishes a public REST API and a remote MCP server covering competitor connections, accounts, priority-scored activity, and lead lists, which means your coverage and detection-lag numbers can be computed on a schedule instead of assembled from screenshots the night before the review.
What this actually buys you
The real return on measuring a CI program is not the budget defense, although that is the reason most teams finally do it. It is that the nine numbers tell you which part of the machine is broken.
Coverage good, adoption bad: your intelligence is not usable, so make it shorter and put it where the work happens. Adoption good, outcomes flat: your intelligence is usable but wrong, or it is arriving too late to change the deal, so go look at detection lag per signal class. Everything flat: you are probably watching the wrong competitors, which the watchlist completeness grid will show you in about ten minutes.
That diagnostic loop is the difference between a CI program that compounds and one that produces an impressive volume of documents until the quarter it gets cut. Start with the baseline, pick the five of these nine you can actually source this month, and ship the one-page report before you have perfect data. A report with three honest numbers beats a dashboard with thirty that nobody opens.