There is a specific kind of deal loss that stings more than the rest. You run a clean process, you win the technical evaluation, the champion is on your side, and then procurement asks one question: “is this vendor in the Magic Quadrant?” Three weeks later the deal goes to a competitor whose product your champion liked less.
Analyst placements are the only competitive asset that functions as a procurement gate. They are also the most expensive thing your competitors buy attention for, and the one piece of their positioning that updates on a published, predictable calendar. Most competitive intelligence programs track pricing pages weekly and analyst coverage never, which is backwards. Pricing changes are reversible. A Leaders quadrant placement reshapes a competitor’s enterprise motion for the next twelve months.
This post covers what to monitor across the analyst landscape, how to read a placement change rather than just note it, and what sales plays each type of movement unlocks.
Why analyst movement matters more than the review sites
Teams already monitor G2, Capterra, and TrustRadius, and those matter for self-serve and mid-market buyers. Analyst coverage operates on a different buyer entirely.
A Gartner or Forrester placement does three things no review site does. It survives procurement review, because a committee can cite it in a business case and nobody gets fired for choosing a Leader. It locks in a comparison set, because once four vendors appear in a grid together, every RFP in that category inherits that shortlist. And it creates a budget window, because enterprise buyers often time evaluations to the publication of the report they intend to cite.
That last point is the one most teams miss. A report publication is not just a marketing event for the vendor who placed well. It is a demand event for the whole category. If you know the date, you know when inbound interest spikes and when your competitors will be at their loudest.
What to actually monitor
“Watch Gartner” is not a plan. The signals live in specific, trackable places, most of which your competitors publish themselves.
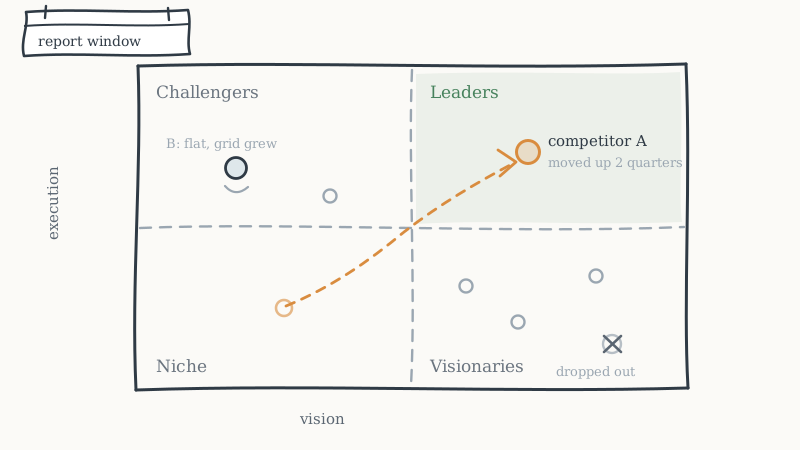
Report inclusion and position changes. The Magic Quadrant, the Forrester Wave, the Gartner Critical Capabilities report, the IDC MarketScape, and category-specific equivalents. You care about four states: newly included, moved between quadrants or segments, dropped out, and stayed put while the category grew.
Peer Insights and Customer Choice activity. Gartner Peer Insights review volume and rating, plus the “Customers’ Choice” distinctions. Unlike the paid reports, this data is public and updates continuously, which makes it a leading indicator for the next formal placement.
The competitor’s own analyst pages. Almost every vendor builds a landing page for their placement, usually at a predictable path like /gartner, /analysts, /recognition, or /awards. These pages change before the press release goes out, and they are frequently published days early and left unlinked. Watching them is the cheapest early warning available.
Gated report reprints. Vendors license the right to distribute a report and put it behind a form. A new reprint offer appearing in a competitor’s resource library tells you both that they placed and that they are now using the report as a lead magnet. If you want the mechanics of tracking that kind of asset, we covered it in the guide to monitoring competitor gated content and lead magnets.
Category naming. Analyst firms rename and merge categories, and vendors scramble to match the new language. If three competitors all start using an unfamiliar category phrase in the same quarter, an analyst coined it and they are all optimizing for the same grid.
Analyst-facing hires. A req for an Analyst Relations Manager, or a Product Marketing role with “analyst relations” in the scope, is a nine to twelve month leading indicator of a submission attempt. Vendors do not fund that role unless they intend to place.
Conference and webinar co-appearances. Analyst-hosted webinars, Gartner Symposium presence, and sponsored sessions all signal an active relationship well before any report lands.
How to read the movement, not just log it
A placement change is data. The interpretation is the intelligence, and the same move means different things depending on context.
New inclusion. The vendor crossed a revenue or customer-count threshold, because inclusion criteria are mostly quantitative. A competitor appearing in a grid for the first time is telling you their enterprise segment is real now, whatever their marketing said last year. Expect them to raise prices and add an enterprise tier within two quarters.
Upward movement. Usually reflects execution and customer references rather than product. Vendors move right on vision by changing their narrative and up on execution by proving retention. Read which axis moved, because it tells you whether to fight on roadmap or on proof.
Lateral movement, grid growing. If a competitor held position while six new vendors entered, they lost relative ground without any visible change. This is the most underrated signal in the set and the one their sales team will never mention.
Dropping out. Rarely a product failure. Usually it means they missed a revenue threshold, declined to participate, or got reclassified into a different category. All three are usable. A vendor who declined to participate is almost always conserving cash or avoiding a comparison they expect to lose.
Peer Insights volume spike with flat rating. A review campaign is running, which means a submission is being prepared. You have roughly two quarters of warning.
Peer Insights rating decline. Enterprise dissatisfaction that has not yet reached the formal report. This is your best source of fresh, citable objection material, and it ages fast, so the value is in catching it early rather than reading it in next year’s report.
Turning placements into plays
Intelligence that does not change a sales motion is trivia. Each signal maps to a specific action.
| Signal | What it means | Play |
|---|---|---|
| Competitor newly included | They cleared an enterprise threshold | Audit your own eligibility against the public criteria; brief sales on the procurement objection now, not after it is raised |
| Competitor moved up | Execution or vision score improved | Identify which axis moved and build the counter around the other one |
| Competitor held while grid grew | Relative decline, invisible publicly | Reframe the category in your own comparison content |
| Competitor dropped out | Threshold miss, declined, or reclassified | Qualify their renewal base; unstable analyst coverage often precedes account instability |
| Report publication date approaching | Category-wide demand window | Time outbound and content to the window, not to the competitor’s announcement |
| Analyst relations hire posted | Submission attempt in 9 to 12 months | Start your own reference and review groundwork now |
The pattern worth internalizing: the useful window is before the announcement, not after. Once the press release goes out, your competitor has a Leaders badge on every slide and your sales team is playing defense. The signals above are all visible weeks to months earlier.
Build the monitoring, do not do it by hand
The reason most teams skip this is that the manual version is miserable. Analyst coverage is scattered across paid reports, public Peer Insights pages, competitor microsites, and conference agendas, and the changes are irregular enough that a quarterly manual sweep misses most of them.
A workable setup has four pieces.
A tracked page list per competitor. Their analyst or recognition page, their press and newsroom index, their resource library filtered to reports, and their careers page filtered to marketing roles. Automated change detection on those four URLs catches the majority of the signal, and page-level change monitoring is exactly what CAM’s competitor monitoring features are built to watch continuously rather than on a human schedule.
Peer Insights snapshots. Record review count and average rating per competitor monthly. The absolute numbers matter less than the slope.
A category calendar. Note the historical publication month for each relevant report. Most firms hold roughly to an annual cadence, so last year’s date is a solid estimate for this year’s window.
A diff log, not a description. Record what changed, the date you detected it, and your read of why. Descriptions age badly. Dated diffs compound into a timeline you can reason about, and they turn into competitor battlecard content without a rewrite.
The signal analyst reports cannot give you
Analyst coverage has one hard limitation: it is retrospective and slow. A Magic Quadrant describes the market as it looked during a research window that closed months before publication. It will tell you a competitor has gone enterprise. It will not tell you which of your accounts their reps are working this week.
That gap is the reason analyst monitoring is a complement to go-to-market monitoring, not a substitute. The analyst calendar tells you when the category gets loud and which comparison set you are stuck in. It cannot tell you that a competitor’s account executive connected with three people at your largest renewal yesterday.
That second signal is what CAM was built for. CAM continuously monitors the new LinkedIn connections your competitors’ sales reps make, enriches each one with verified email, phone, and company data, scores it against your ICP, and delivers a ranked lead list every week with real-time alerts. Where an analyst report tells you a competitor has become credible to enterprise buyers, connection monitoring tells you which specific enterprise buyers they are talking to, and leads sync straight into HubSpot, Salesforce, or Clay so the alert lands where your team already works.
Run both. The analyst layer sets your positioning and your timing. The connection layer sets your target list.
A one-week starting plan
Day one. List your three closest competitors and find their analyst or recognition pages. Record the current claim verbatim with the date.
Day two. Pull Peer Insights review count and rating for each. This is your baseline.
Day three. Find last year’s publication date for the two reports that matter most in your category. Put the estimated window on next quarter’s calendar.
Day four. Set up automated change detection on each competitor’s analyst page, newsroom, and resource library.
Day five. Write the procurement objection handler for the strongest placement any competitor currently holds. Do it now, while nobody is panicking about a live deal.
The takeaway
Analyst placements are a procurement gate, a comparison-set lock, and a scheduled demand event, which makes them worth monitoring far more than most competitive intelligence programs assume. The movement matters more than the position, and lateral movement in a growing grid is the signal almost everyone misses.
But treat the analyst layer for what it is: a slow, retrospective read on category credibility. Pair it with continuous monitoring of what competitor sales teams are doing right now, and you get both halves of the picture. You can see which competitors to take seriously, and which of your accounts they are already working.