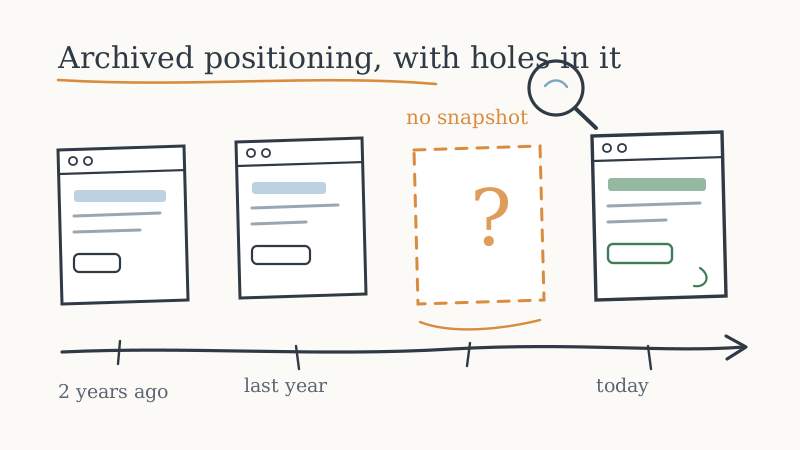
Every competitive intelligence team eventually discovers the Wayback Machine, pastes in a competitor’s domain, clicks around a few old homepages, says “huh, interesting,” and closes the tab. That is the entire extent of how most teams use the single largest free archive of competitor positioning that has ever existed.
Used properly, the Internet Archive answers questions no current-state research can touch. Not what a competitor claims today, but what they claimed before, how many times they have changed their mind, which bets they quietly abandoned, and how fast their story is moving. That history is strategic. A competitor who has rewritten their homepage headline four times in eighteen months is telling you something very different from one who has not touched it since launch.
This post covers how to reconstruct a competitor’s positioning timeline from archived snapshots, what specific signals to read out of it, where the archive will lie to you, and why the archive is the wrong tool for anything from today forward.
What the archive can tell you that current-state research cannot
Looking at a competitor’s website today gives you a single frame. You see the current headline, the current pricing, the current feature list, and you have no idea whether any of it is new. A timeline gives you the derivative: direction and velocity.
Four questions become answerable once you have the history:
How stable is their positioning? A company that has held the same core claim for three years has either found product-market fit or has stopped paying attention. A company that rewrites its category every two quarters is still searching. The second company is easier to beat on positioning and harder to predict on roadmap.
What did they try and drop? Abandoned positioning is the most underrated intelligence in the archive. A product name that appeared on the nav for six months and then vanished is a failed bet. An industry vertical that had its own landing page and then disappeared is a market they could not crack. Both tell you where their edges are, and both are things their sales team will never volunteer.
When did they move upmarket or downmarket? Pricing pages, the presence or absence of a free tier, the removal of self-serve signup, and the arrival of “Contact sales” on a plan card all leave dated fingerprints. You can pin the exact quarter a competitor decided to chase enterprise, which usually explains everything else they did that year.
Who were they positioning against? Comparison pages, competitor names in copy, and the specific objections they pre-handle on the homepage all shift as their competitive set shifts. If your own name appeared on their site twelve months ago and is gone now, that is a signal. If it just appeared, that is a bigger one.
None of this requires special access. It requires reading snapshots in order instead of at random.
How to actually reconstruct the timeline
The mistake is browsing. Browsing produces anecdotes. What you want is a dated table, because a table makes change visible and anecdotes do not.
1. Pull the snapshot index, not the calendar view
The Wayback Machine’s calendar UI is built for casual browsing. The useful interface is the CDX index, which returns a machine-readable list of every capture it holds for a URL. A request to web.archive.org/cdx/search/cdx?url=rival.com&output=json&collapse=digest returns one row per capture where the content actually changed, which is exactly the list you want. The collapse=digest parameter is the important part: it drops consecutive identical captures and leaves you with only the dates where something was different.
That single query turns thousands of snapshots into a short list of real change events, usually a few dozen over several years.
2. Build the page list before you build the timeline
Do not timeline the homepage alone. The homepage is the most carefully managed page on any site, which means it is the slowest to reflect change. The pages that move first and matter most:
/pricingfor packaging, tiers, and the move up or down market/featuresor the product nav for scope changes and abandoned modules/customersand/case-studiesfor segment shifts, since logos change before copy does/aboutand/careersfor headcount and stage signals/compare/*or/vs/*for the competitive set- the blog index for publishing cadence and category bets
Run the CDX query once per page. Six queries give you a far richer picture than fifty clicks on the homepage calendar.
3. Record a diff, not a description
For each dated change event, write one line: the date, the page, and what actually changed in a single sentence. “2025-03-14, pricing, Starter tier removed and lowest plan moved from 29 to 99 dollars.” That is it. Resist the urge to write analysis in the table. The analysis emerges once the rows are in order, and it emerges much more clearly than it would if you editorialized each row.
4. Read the clusters, not the individual rows
Positioning changes almost never ship alone. When you lay the rows out by date, you will see clusters: three or four pages all changing inside the same two week window. Those clusters are the real events. A homepage headline change on its own is a copy test. A homepage headline change plus a new pricing tier plus two new enterprise logos plus a careers page that suddenly lists a VP of Sales role is a strategy change, and you can date it to the week.
Isolated changes are noise. Clusters are decisions.
5. Anchor the timeline against outside events
Once you have your clusters, overlay the public record: funding announcements, leadership hires, acquisitions, product launches. The causality usually becomes obvious. A cluster six weeks after a Series B is the capital being deployed. A cluster three months after a new CMO starts is the new CMO’s thesis shipping. Dating the cluster is what makes the attribution possible, and attribution is what makes the intelligence usable in a sales conversation.
The signals worth looking for specifically
A few patterns recur often enough to be worth naming.
The headline that keeps getting shorter. Early-stage companies describe what their product does. As they find their category, the headline compresses into a claim. A headline that has gone from twenty words to six over two years is a company that has figured out who it sells to. Expect them to be sharper in deals.
The disappearing free tier. The single most reliable upmarket signal. When the free plan goes away, or self-serve signup gets replaced with a demo form, they have decided that small customers cost more than they are worth. That is the quarter to go take their SMB base.
The vertical page that came and went. A dedicated page for an industry, live for two quarters and then gone, means they staffed a vertical push and it did not pay back. If that vertical matters to you, you now know they tried and failed there.
The competitor name that appears in copy. When a rival starts pre-handling objections about a specific competitor on their own site, that competitor has become a real threat in their deals. Watch for your own name showing up, and for whose name it replaced.
The logo wall that changed shape. Customer logos are the most honest segment signal on any website. A wall of startup logos becoming a wall of recognizable enterprise brands is a confirmed upmarket move, not an aspirational one.
Where the archive will lie to you
This is the part most teams skip, and it is the part that makes the difference between research and confident nonsense.
Coverage is uneven and not under your control. The Internet Archive crawls what it crawls. Popular domains get captured often, obscure ones rarely. A page can go months with no capture at all, which means a change you date to March may well have shipped in January. Your timeline has error bars, and they are wider than they feel.
You cannot see what was never crawled. Pages behind authentication, pages excluded by robots rules, and pages that existed briefly between crawls are simply absent. The most interesting changes, the ones that shipped and got reverted inside a week, are exactly the ones least likely to be captured. The archive is systematically biased toward changes that stuck.
Rendering is unreliable. Archived pages pull assets from the archive too, and JavaScript-heavy sites frequently render wrong or render blank. An archived page showing no pricing table does not mean there was no pricing table. Always check the page source before concluding something was absent.
Retroactive removal happens. Site owners can request exclusions, and historical captures can disappear from the index. The archive you read today is not guaranteed to be the archive you read last year.
Dates are capture dates, not change dates. This is the structural limit. Every conclusion you draw is of the form “this had changed by this date,” never “this changed on this date.” For reconstructing the past, that is usually good enough. For anything operational, it is not even close.
The archive is for history, not for monitoring
Here is the honest framing: the Wayback Machine is an excellent tool for answering questions about the past and a terrible tool for noticing anything in the present.
Every limitation above compounds when you try to use the archive as a monitoring system. You would be polling a third party’s crawl schedule, hoping it happened to capture the week a competitor repositioned, and finding out weeks or months late. Competitive intelligence that arrives a month after a competitor changed their pricing is a history lesson, not a sales advantage. By the time the archive confirms a change, your reps have already lost the deals where it mattered.
The correct split is simple. Use the archive once, up front, to build the baseline: the positioning timeline, the abandoned bets, the pattern of how fast this competitor moves. That baseline is genuinely valuable and you can only get it from the archive. Then stop relying on the archive entirely and put continuous monitoring on the pages that matter so that from today forward you have your own capture history, on your own schedule, with real change dates instead of crawl dates.
That is exactly the gap CAM is built for. It watches the specific competitor pages you care about on a cadence you set, filters out cosmetic churn so you are not drowning in alerts about rotating timestamps, and tells you the day something meaningful changes rather than whenever a public crawler next happens by. The archive gives you the last three years. Continuous monitoring with CAM gives you the next three, with timestamps you can actually trust and route into a sales conversation while the change is still news.
The same logic applies across the rest of the competitive picture. Public archives and one-time research give you a snapshot of a competitor’s outbound motion, but seeing their activity as it happens takes a live feed, which is why teams pair page monitoring with LinkedIn activity tracking rather than periodic manual checks. And if the intelligence you gather feeds outbound plays, the downstream mechanics matter too: validating your list with Scrubby before you send protects the deliverability of a campaign built on a time-sensitive competitor signal, and booking the meeting through calendar-first outreach with Kali keeps the response window short enough that the signal is still fresh when the call happens.
A one-afternoon starting playbook
If you want the baseline without turning this into a project:
- Pick your three most important competitors. Not ten. Three.
- For each, run the CDX query with
collapse=digestagainst six URLs: homepage, pricing, features or product, customers, about, and any comparison page. - Put every change event in one spreadsheet with three columns: date, page, one-sentence diff. All three competitors in the same sheet, sorted by date.
- Highlight the clusters where multiple pages changed inside the same two weeks. Those are your strategy events.
- Annotate each cluster with the public events nearby: funding, hires, launches, acquisitions.
- Write one paragraph per competitor answering a single question: what direction are they moving, and how fast?
- Then set up continuous monitoring on those same URLs so you never have to reconstruct history again.
Step seven is the one that matters long term. Steps one through six are a one-time cost that gives you context no competitor’s own sales team will ever hand you.
The takeaway
The Internet Archive is the only place you can see what a competitor used to believe. That history tells you which bets they abandoned, when they changed direction, and how quickly their story moves, and all of it is free and sitting in a public index most teams never query properly.
But the archive runs on somebody else’s crawl schedule, and a positioning change you learn about six weeks late is trivia. Mine the archive once for the baseline, then own your own change history going forward. The teams that win competitive deals are not the ones with the best reconstruction of last year. They are the ones who find out on Tuesday.